StrategyLab

Test the idea
before you
fund it.

StrategyLab runs a trading strategy against real historical prices and shows you every simulated buy and sell, every win, every loss. Paper money only.

Try it free See how it works

No sign-up to try. An example is already loaded.

Date29 Sep 2026
BTC-USD close$83,638
Example strategyHolding
Its account$10,723
Buy & hold$13,737
1 Oct 202429 Sep 2026

Every candle here is real: BTC-USD daily candles, 1 Oct 2024 to 29 Sep 2026, Coinbase Exchange. Markers show where the tool’s example strategy (SMA 20 / 50, starting with $10,000) bought and sold, computed by the same engine the tool runs. Drag the ruler to move through time.

1 of 4

Choose a strategy

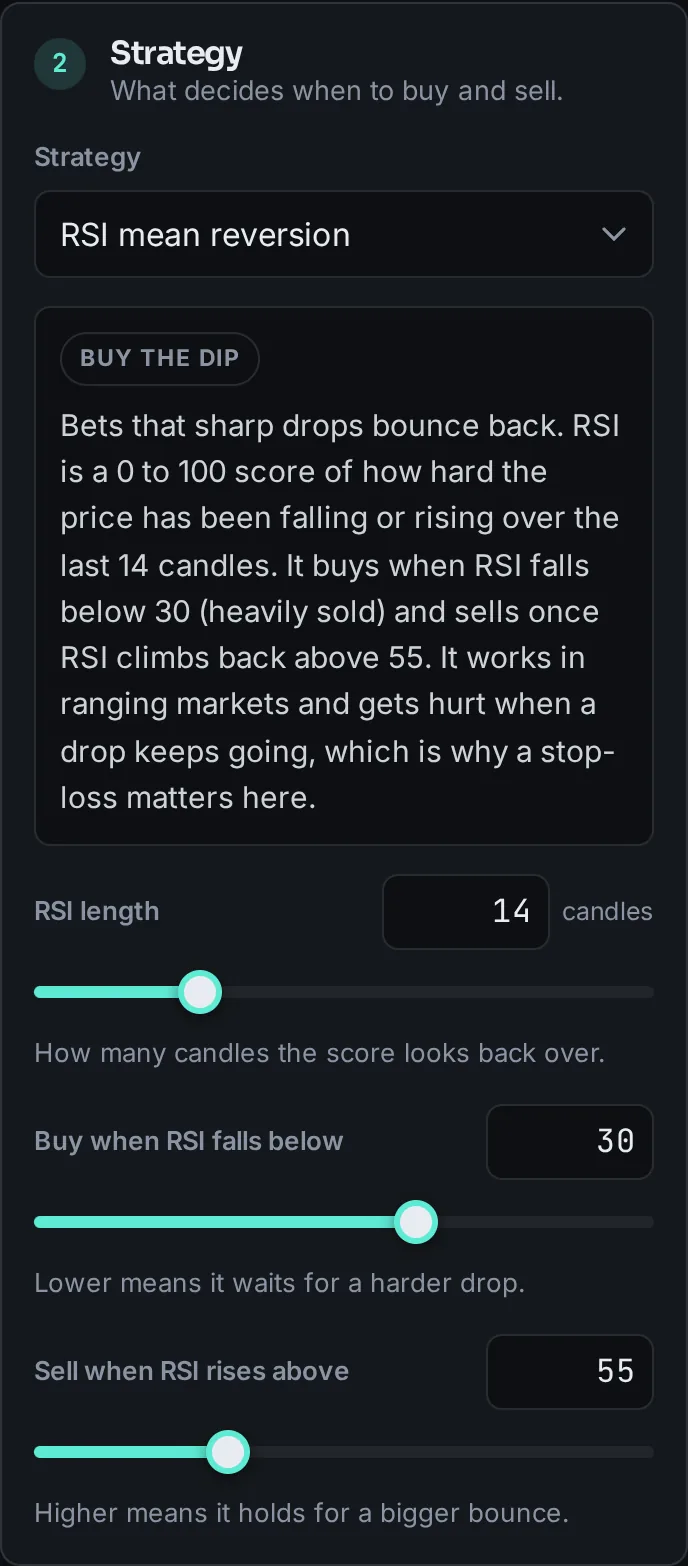
Eight strategies, each explained the way a person would say it. Move a slider and the explanation changes with it, so you always know exactly which rule you are testing.

  • Trend following, dip buying, breakouts, momentum and steady buying
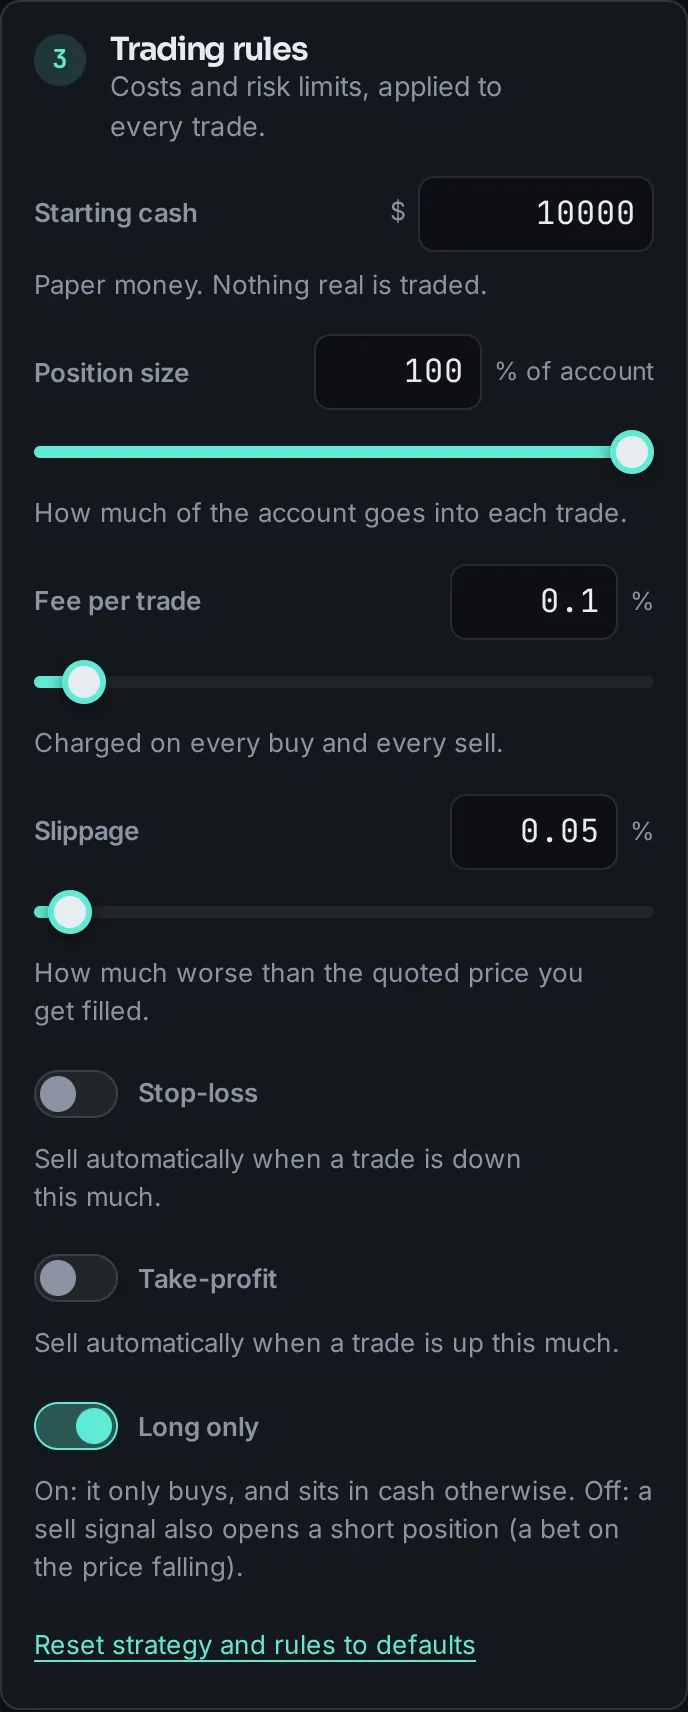
  • Starting cash, position size, fee and slippage are yours to set
  • Optional stop-loss and take-profit; long only, or allow shorts
The Strategy panel set to RSI mean reversion, with its plain-English explanation and three sliders.
The Trading rules panel: starting cash, position size, fee, slippage, stop-loss, take-profit and long only.
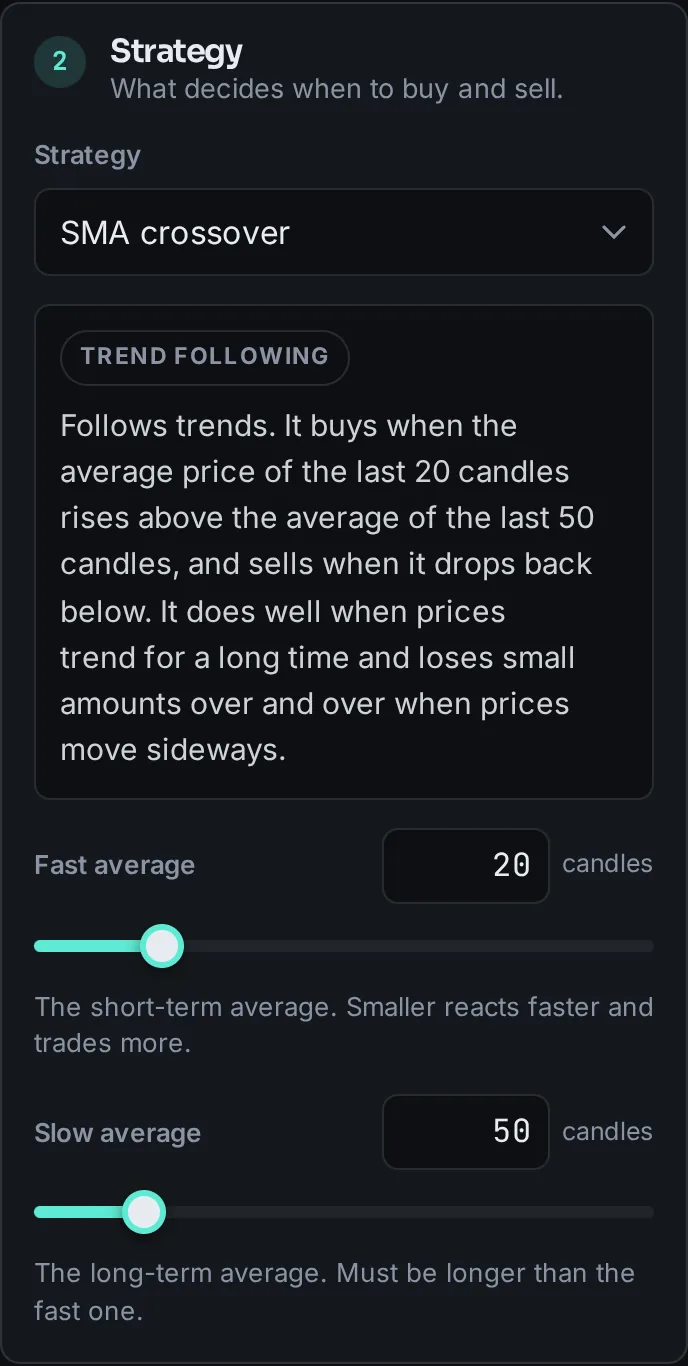
The Strategy panel set to SMA crossover: "Follows trends. It buys when the average price of the last 20 candles rises above the average of the last 50 candles", with fast and slow average sliders.
Fig. 1Strategy and trading-rule panels from the tool.

2 of 4

Test it on real history

Pick a market and a period. StrategyLab loads real candles from Coinbase Exchange and runs your rules across them: decide on the close, fill at the next open, fees and slippage taken out. The answer starts with one sentence against buy & hold.

  • Twelve crypto pairs, daily candles on Free
  • Twelve numbers, each with a plain explanation
  • Price chart with every buy and sell marked
Price chart of BTC-USD from October 2024 to September 2026 with the 20 and 50 candle averages and arrows where the strategy bought and sold.
Results: "SMA crossover on BTC-USD turned $10,000 into $10,723.08 (+7.23%). Buying and holding would have made +37.37%, so the strategy trailed it by 30.14%", a warning about only 9 trades, and twelve metric tiles.
Fig. 2The Results tab on first open.Example data

3 of 4

Watch it trade

Replay the test one candle at a time. The position opens, the profit swings, the trade closes into the log. On Pro, run the same strategy on live prices as paper trades for as long as the tab stays open.

  • Play, step, scrub, four speeds
  • Open-position card with entry, size, stop and target
  • Live paper trading on one-minute candles (Pro)
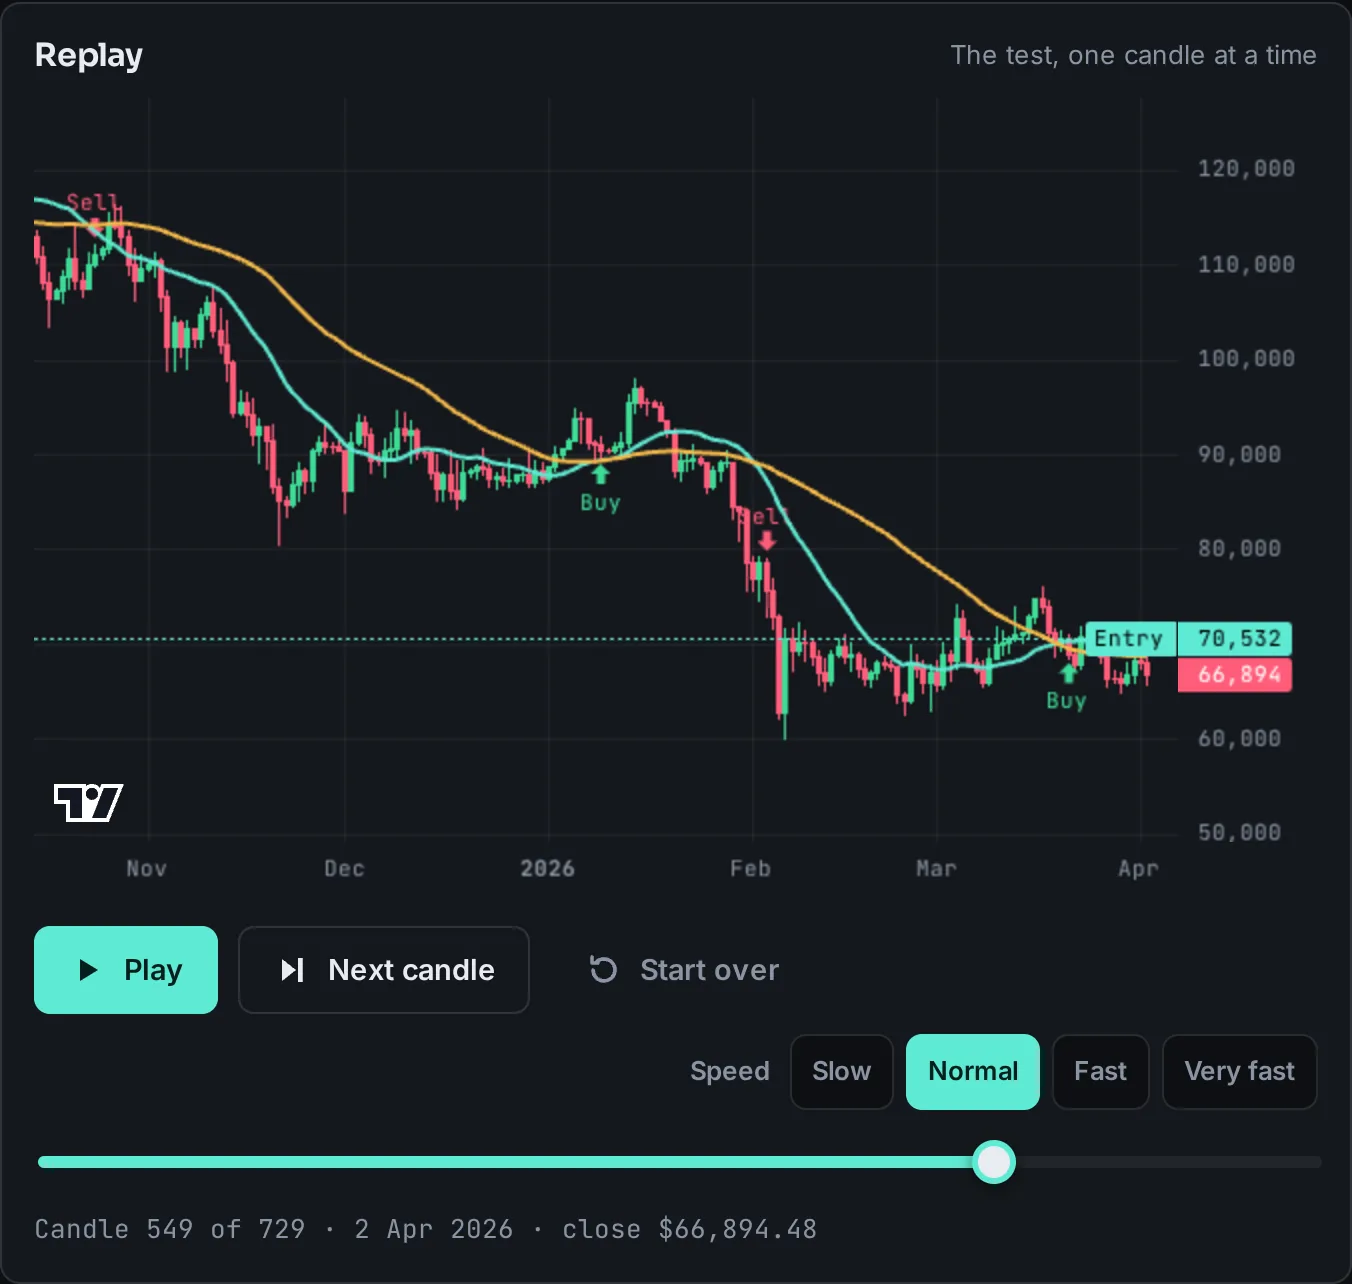
Replay: the chart stopped at candle 549 of 729 with an entry line at $70,532, play, next candle and speed controls and a scrubber.
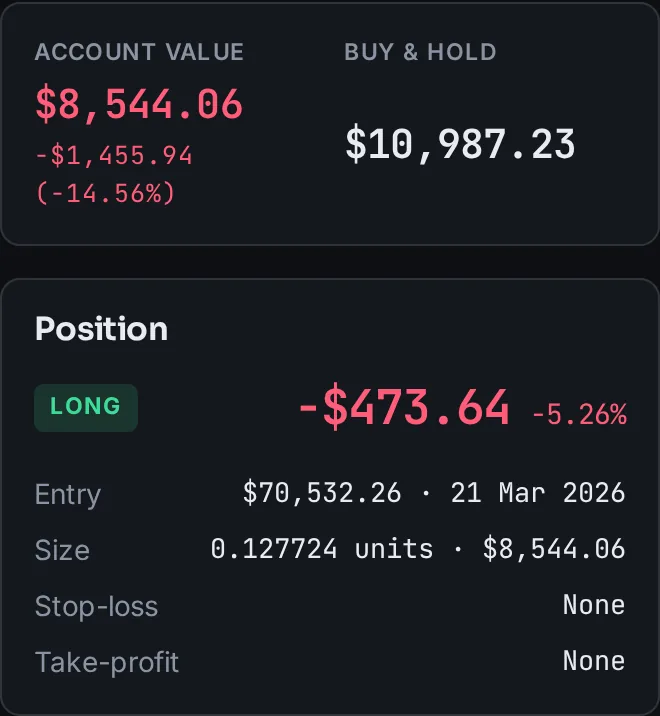
Account value $8,544.06 against buy and hold $10,987.23, and an open long position showing a loss of $473.64, entry $70,532.26 on 21 Mar 2026.
Fig. 3Replay, part-way through an open trade.Example data

4 of 4

Try to break it

Settings tuned until the result looks good have usually just memorized the past. Sweep two settings across a grid and see whether the good results are a region or one lucky cell. Then hold back part of the history and check the settings on prices they never saw.

  • Parameter sweep heatmap, up to 14 × 14 (Pro)
  • In-sample / out-of-sample split (Pro)
  • A warning when there are too few trades to mean anything
In-sample versus out-of-sample: the strategy returned minus 9.82% on the first 510 candles and plus 18.91% on the last 219. Verdict: "The two periods behaved differently; neither result alone says much."
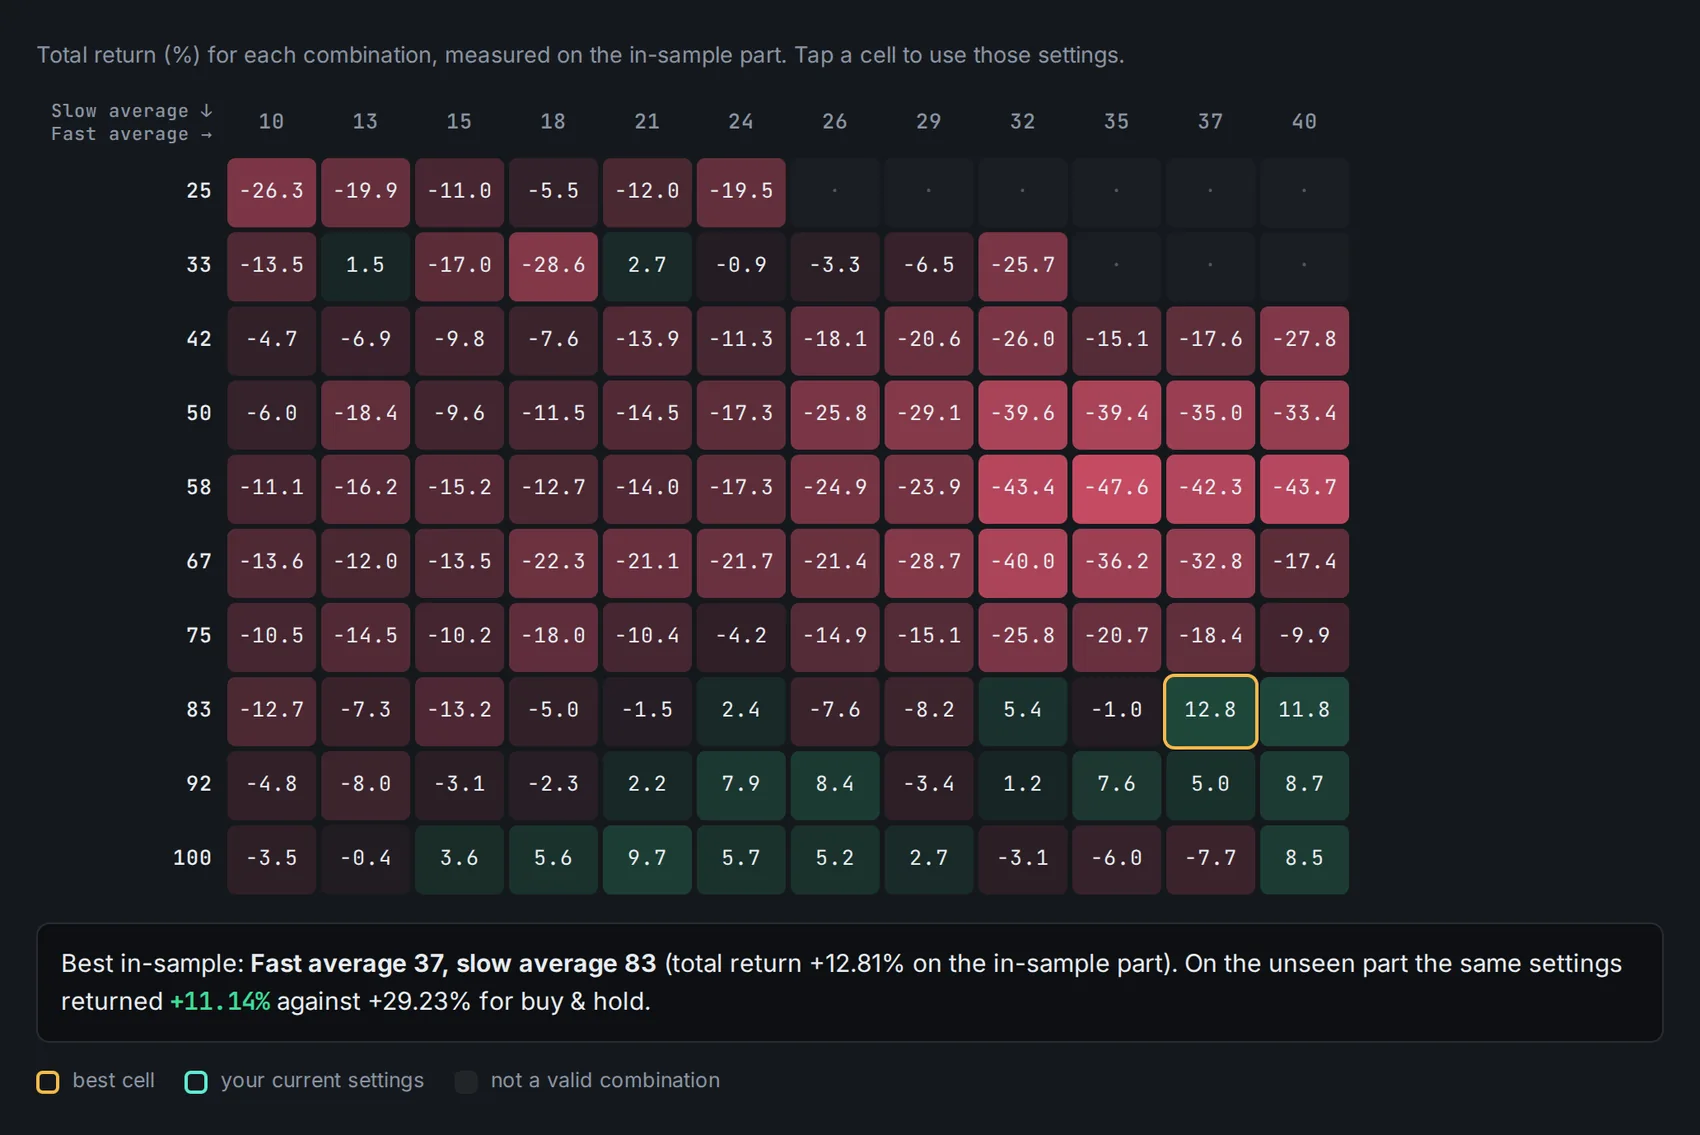
A heatmap of total return for each combination of fast and slow average. Most cells are red; the best in-sample cell is outlined.
Fig. 4Sweep heatmap and the in-sample / out-of-sample check.Example data

It tells you when
a result is luck.

The example on this page made +7.23% over two years. Simply buying and holding made +37.37%. We could have picked an example that flatters the product. This one shows what the product is for.

Below is what the tool said about it, unprompted.

The tool's own verdict: "SMA crossover on BTC-USD turned $10,000 into $10,723.08 (+7.23%). Buying and holding would have made +37.37%, so the strategy trailed it by 30.14%." Below it, a warning: "Only 9 trades. That is too few to tell skill from luck."
Fig. 5The first two things on the Results tab, exactly as the tool shows them.Example data

No look-ahead

A strategy reads a candle only after it has closed. Its order is filled at the next candle's open. It never trades on a price it could not have known.

Costs are in

Every fill is moved against you by the slippage you set and charged the fee you set. Defaults are 0.1% and 0.05%; set them to what you actually pay.

Stops behave like stops

A stop-loss is checked inside each candle from its high and low. A gap through the stop fills at the open, not at the price you hoped for. If one candle touches both stop and target, the stop is assumed first.

A great backtest is not a promise. The more settings you try, the more likely the best one only fits the past by chance, and the future does not repeat it.

Printed under every result and every sweep in the tool.

Twelve numbers,
in plain words.

Every result comes with the same twelve measurements and a glossary one tap away. Here they are for the example, with the tool’s own explanations.

Total return
+7.23%
How much the account grew or shrank over the whole test, after fees and slippage.
Buy & hold
+37.37%
What you would have made by buying at the start and doing nothing. The number to beat.
Yearly growth (CAGR)
+3.56%
The steady yearly rate that would produce the same total return. Short tests exaggerate it.
Max drawdown
−32.22%
The worst fall from a high point to a later low. It tells you how much pain you would have sat through.
Sharpe ratio
0.26
Return compared with how bumpy the ride was. Above 1 is decent, above 2 is rare. Calculated per candle and scaled to a year, with a 0% risk-free rate.
Sortino ratio
0.40
Like Sharpe, but only downward moves count as risk.
Win rate
44%
The share of trades that made money. A low win rate can still be profitable if the wins are big.
Profit factor
1.24
Money made on winning trades divided by money lost on losing trades. Above 1 means a profit overall.
Average win / loss
$947 / −$613
The typical size of a winning trade and of a losing trade, in dollars.
Time in market
45%
The share of candles during which the strategy held a position. The rest of the time it sat in cash.
Trades
9
How many positions were opened. Very few trades means the result could easily be luck.
Final balance
$10,723.08
What the account ended with, starting from the cash you set. Starting cash plus every trade's profit or loss adds up to exactly this.

Values: SMA 20 / 50 on BTC-USD daily candles, 1 Oct 2024 to 29 Sep 2026, Coinbase Exchange, $10,000 starting cash, 0.1% fee, 0.05% slippage. Recorded 30 Sep 2026. An example, not a forecast.
Eight ideas,
one yardstick.

Each strategy below ran on the same two years of Bitcoin with its default settings. The dotted line is buy & hold. Most of them lost to it. That is normal, and it is the first thing a test should tell you.

What each one does, when it works and when it fails

Example runs on BTC-USD daily candles, 1 Oct 2024 to 29 Sep 2026, Coinbase Exchange, default settings, $10,000 starting cash, fees and slippage included. Buy & hold made +37.4% over the same period. Simulated results. Hypothetical performance has limits and is not a guarantee of future returns. Educational use only, not investment advice.

Free to test.
$29 to go deeper.

Free covers the whole loop on daily candles: choose, test, replay, save. Pro adds smaller candles, the full history, and the tools for trying to break a strategy.

Compare the plans line by line

Free

$0no card needed

Test ideas on daily prices.

  • 3 saved strategies
  • Daily candles
  • Up to 2 years of history
  • All 8 strategies
  • Candle-by-candle replay
Start free

Pro

$29per month

Everything, for people who test a lot.

  • Unlimited saved strategies
  • Intraday candles, down to 1 minute
  • Full price history
  • Parameter sweeps
  • In-sample / out-of-sample split
  • Live paper trading
  • CSV export of trades
  • Share links to results

Simulated results. Hypothetical performance has limits and is not a guarantee of future returns. Educational use only, not investment advice. Risk disclosure

Before
you ask.

All 14 questions

Does StrategyLab trade real money?

No. It is a simulator. There is no broker connection, no deposit and no order ever leaves your browser. Backtests, replay and live paper trading all use paper money.

Where do the prices come from?

From Coinbase Exchange's public market data. If Coinbase does not answer, the tool falls back to Binance's public data for the same pair. Under the Market panel it states what was loaded: the number of candles, the first and last date and the source.

How is a simulated trade filled?

The strategy decides when a candle closes and the order fills at the next candle's open, moved against you by the slippage you set and charged the fee you set. Stop-losses and take-profits are checked inside each candle using its high and low. If a candle gaps through a stop, the fill is at the open.

If my backtest looks great, will the strategy make money?

Not necessarily. A backtest shows how a rule would have done on one stretch of the past, with assumptions about fills and costs. The more settings you try, the more likely the best one only fits that stretch by chance. Use the warnings, the sweep and the out-of-sample check, and treat every result as a hypothesis.

The example is
already running.

Open the tool and an SMA crossover is testing itself on two years of real Bitcoin prices. Change one setting and watch the result move. No account until you save.

Try it freeSee pricing

Simulated results. Hypothetical performance has limits and is not a guarantee of future returns. Educational use only, not investment advice. Risk disclosure