StrategyLab

From an idea
to a verdict.

Pick a rule. Run it on real prices. Watch what it would have done, one candle at a time. Then try to prove it wrong. This page shows every part of the tool, with nothing that is not in it.

Backdrop: real BTC-USD daily candles, 1 Oct 2024 to 29 Sep 2026, Coinbase Exchange.

Real prices, and it tells you which ones

Candles come from Coinbase Exchange's public market data. Under the Market panel the tool states exactly what it loaded: how many candles, the first and last date, and the source. If Coinbase does not answer, it switches to Binance's public data and says so.

  • Twelve liquid crypto pairs, including BTC, ETH and SOL against the dollar
  • Daily candles on Free; 6-hour, 1-hour, 15, 5 and 1-minute candles on Pro
  • History presets from six months to everything available, or your own dates
  • Long histories load with a percentage and time left, never a bare spinner
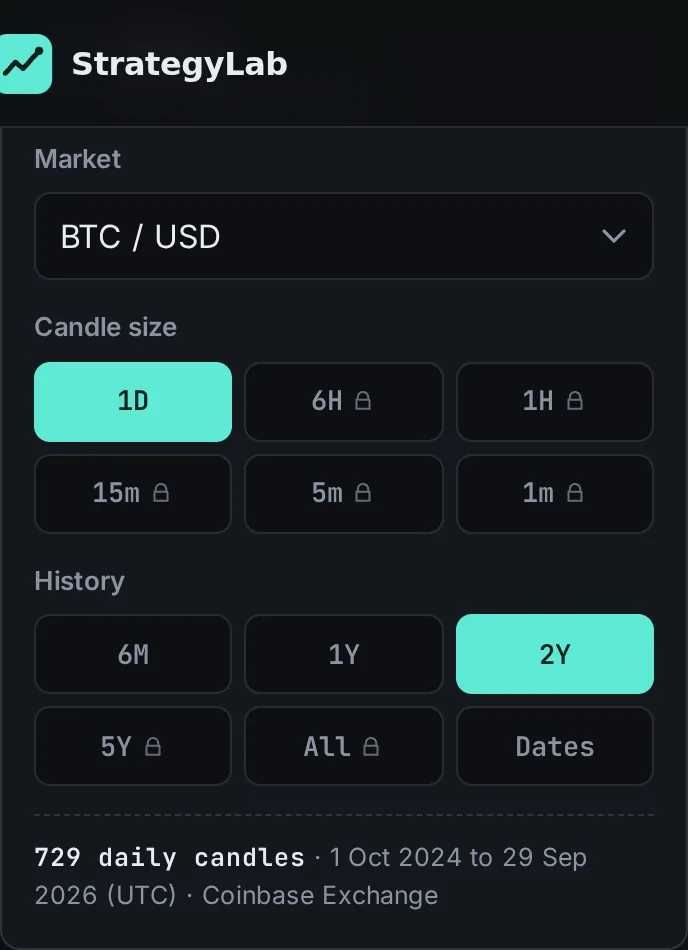
The Market panel: BTC / USD selected, daily candles, two years of history, with the note "729 daily candles, 1 Oct 2024 to 29 Sep 2026 (UTC), Coinbase Exchange".
Fig. 1The Market panel. The last line is the receipt for the data.Example data

Eight strategies with adjustable rules

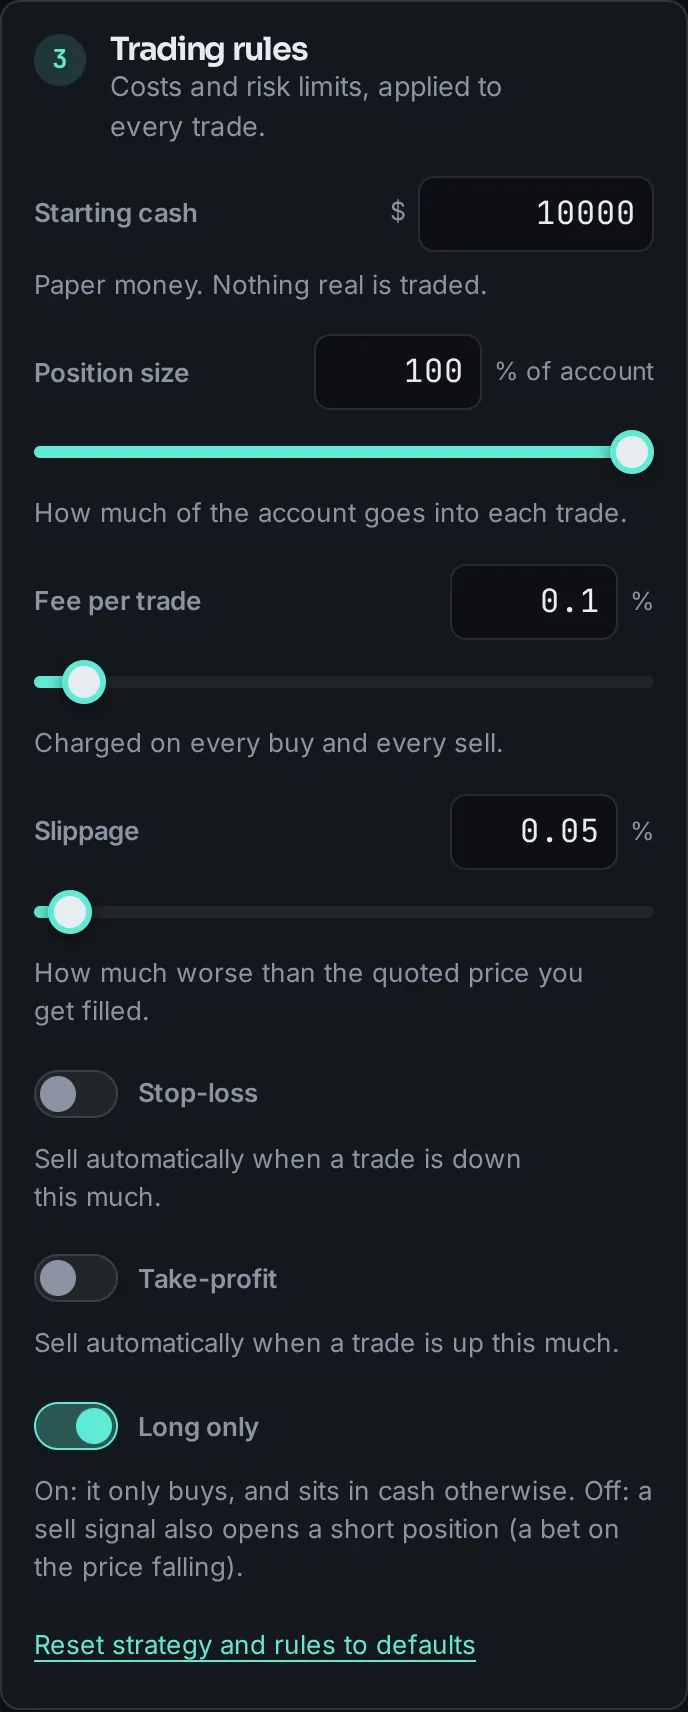
Each strategy has a short explanation that rewrites itself as you move the sliders, so the sentence on screen is always the rule being tested. Trading rules sit underneath: starting cash, how much of the account goes into each trade, fee, slippage, an optional stop-loss and take-profit, and whether shorts are allowed.

  • A slider and a number box for every setting
  • Every change re-runs the test at once
  • One tap resets strategy and rules to their defaults
The Trading rules panel with starting cash $10,000, position size 100%, fee 0.1%, slippage 0.05%, and switches for stop-loss, take-profit and long only.
Fig. 2Trading rules. Costs are on by default.Example data

A verdict first, then the evidence

Results open with one sentence: what the strategy turned your starting cash into, and how that compares with buying and holding. Then warnings if the test is too thin to trust, twelve tiles with a glossary, the price chart with every buy and sell, account value against buy & hold with the drawdown underneath, a month-by-month table and the full trade list.

  • Warns when there are too few trades or not enough history
  • Trade list shows entry, exit, size, profit or loss, candles held and why it closed
  • CSV export of the trade list (Pro)
Results for the example: "SMA crossover on BTC-USD turned $10,000 into $10,723.08 (+7.23%). Buying and holding would have made +37.37%", the warning "Only 9 trades. That is too few to tell skill from luck", and twelve metric tiles.
Fig. 3The Results tab for the built-in example.Example data
Account value chart: the strategy line stays near $10,000 while the dotted buy and hold line climbs to $20,000 and falls back; a red drawdown panel underneath.
Fig. 4Account value against buy & hold, with drawdown in the lower panel.Example data
Monthly returns table for 2024 to 2026 with green and red cells.
Fig. 5Monthly returns, in percent.Example data
Trade list with nine rows: side, entry, exit, size, profit or loss, candles held and closing reason.
Fig. 6Every trade, with the reason it closed.Example data

Replay: the test, one candle at a time

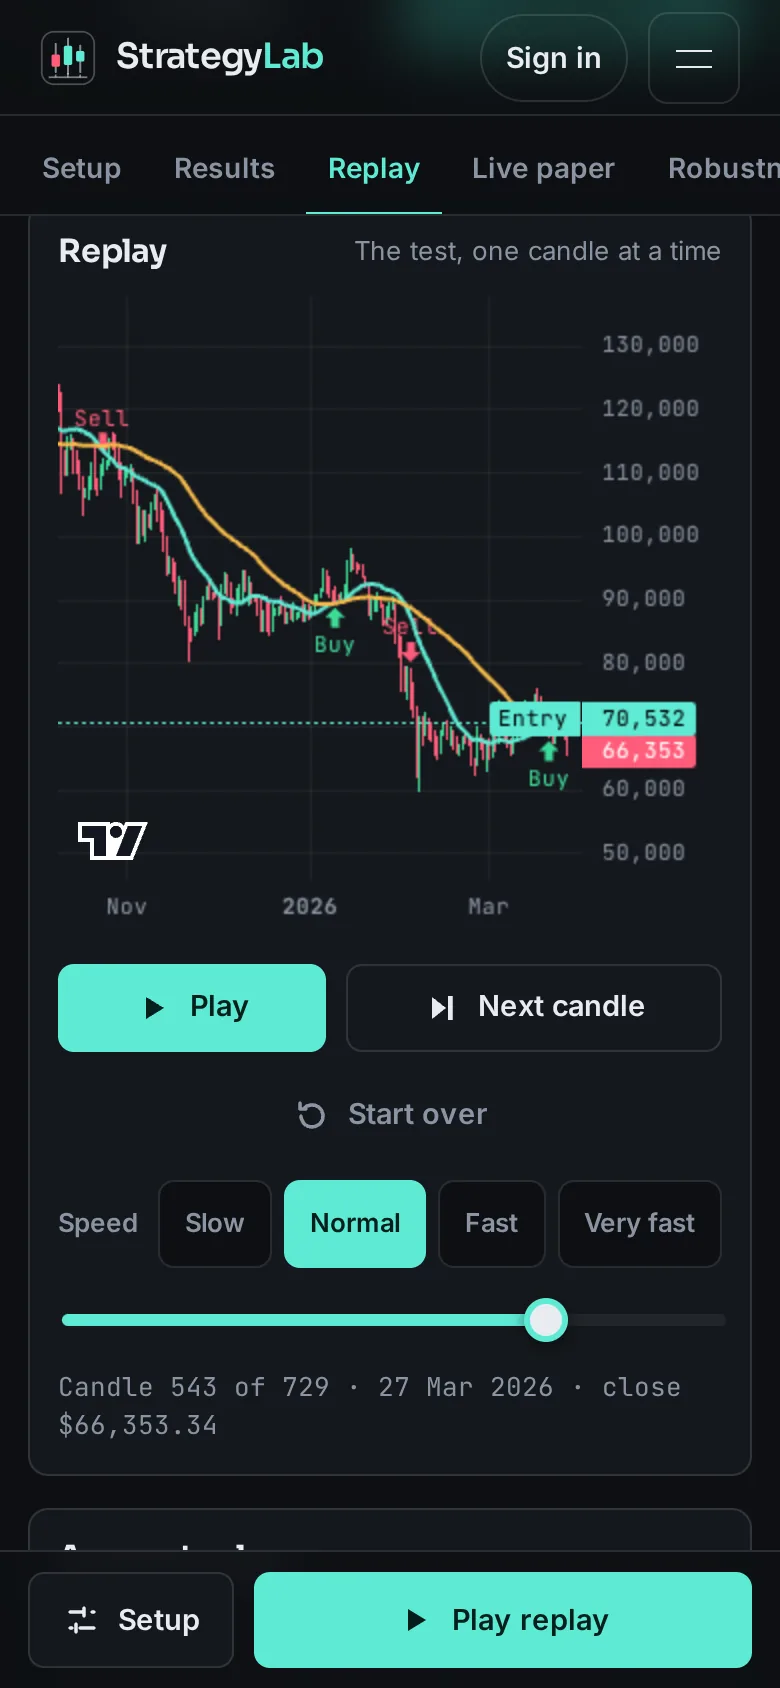
A final number hides what it felt like to get there. Replay walks through the finished backtest in order. You watch the position open, see the profit swing with each candle, and see the trade drop into the log when it closes. It reveals the backtest's own numbers; nothing is recomputed or dressed up.

  • Play and pause, step one candle, start over, four speeds, a scrubber
  • Entry, stop and target drawn as lines on the chart
  • The signal decided on the current candle, in words
Replay at candle 549 of 729: a price chart with an entry line at $70,532, an open long position showing a loss of $473.64, and a trade log with five closed trades.
Fig. 7Replay, part-way through an open trade.Example data

Live paper tradingPro

Run the strategy on prices as they happen. The tool builds one-minute candles in your browser from Coinbase's public feed and acts on each candle close, filling at the next traded price. No orders are placed and no money moves. It runs while the tab is open and stops when you close it; the last session survives a reload and can be saved.

  • Status line, last price and a countdown to the candle close
  • Position card, trade log, live chart and account value
  • A recorded session of real trades to try it without waiting, clearly badged "Recorded, not live"
Live paper trading on a recorded session: one-minute candles with buy and sell markers, an open long position, a two-trade log and the account value chart.
Fig. 8Live paper, here on the recorded session of real BTC-USD trades from 30 Sep 2026.Example data

Robustness: try to break itPro

Two tools for the question that matters most: is this result real, or did the settings just fit the past? The split tunes on the first part of the history and judges on the rest. The sweep tests a grid of two settings and colors each cell, so you can see whether good results form a region or stand alone.

  • Split slider from 50% to 90%, both halves side by side with a plain verdict
  • Sweep up to 14 × 14 with a progress bar; color by the metric you choose
  • The best cell is checked on the unseen part; tap any cell to apply it
Parameter sweep heatmap of fast average against slow average. Most cells are red; a few green cells cluster at the bottom. A note reads: best in-sample fast average 37, slow average 83, +12.81% in-sample, +11.14% on the unseen part against +29.23% for buy and hold.
Fig. 9A 12 × 10 sweep of the example. Mostly red, and the tool says so.Example data
In-sample versus out-of-sample panel: minus 9.82% on the first 510 candles, plus 18.91% on the last 219, and the verdict "The two periods behaved differently; neither result alone says much."
Fig. 10In-sample against out-of-sample, with the verdict in a sentence.Example data

Save it, share it

Nothing asks for an account until you save. A saved strategy keeps the whole setup and reopens with one tap. A share link (Pro) is a public, read-only page of one result. It stores the exact candles it was run on, so it shows the same numbers for as long as the link exists, whatever prices do next.

  • Three saved strategies on Free, unlimited on Pro
  • Share pages need no account to view; they show your account name and the disclaimer
  • Saved live sessions keep their trade log
The Saved tab: two saved strategies with their return when saved, one share link with copy and view buttons, and one saved live paper-trading session.
Fig. 11The Saved tab. Names here are examples.Example data
A shared backtest page titled EMA 12/26 on Bitcoin, marked read-only, with the disclaimer, the verdict sentence, twelve tiles and the price chart.
Fig. 12What a share link opens: a public, read-only page with the disclaimer at the top.Example data

How a simulated
trade is filled.

A backtest is only as honest as its assumptions. These are the engine’s, in plain words. They are the same for the backtest, the replay and live paper trading, because all three run the same code.

No look-ahead

A strategy reads a candle only after it has closed. Its order is filled at the next candle's open. It never trades on a price it could not have known.

Costs are in

Every fill is moved against you by the slippage you set and charged the fee you set. Defaults are 0.1% and 0.05%; set them to what you actually pay.

Stops behave like stops

A stop-loss is checked inside each candle from its high and low. A gap through the stop fills at the open, not at the price you hoped for. If one candle touches both stop and target, the stop is assumed first.

The benchmark pays too

Buy & hold runs on the same candles with the same fee and slippage, fully invested. The comparison is like for like.

The money adds up

Starting cash plus the profit or loss of every trade equals the final balance, to the cent. A position still open at the end is valued at the last close and listed as "Open at end".

Same input, same output

The engine is deterministic. Run the same test twice and you get the same trades.

The whole tool,
one thumb.

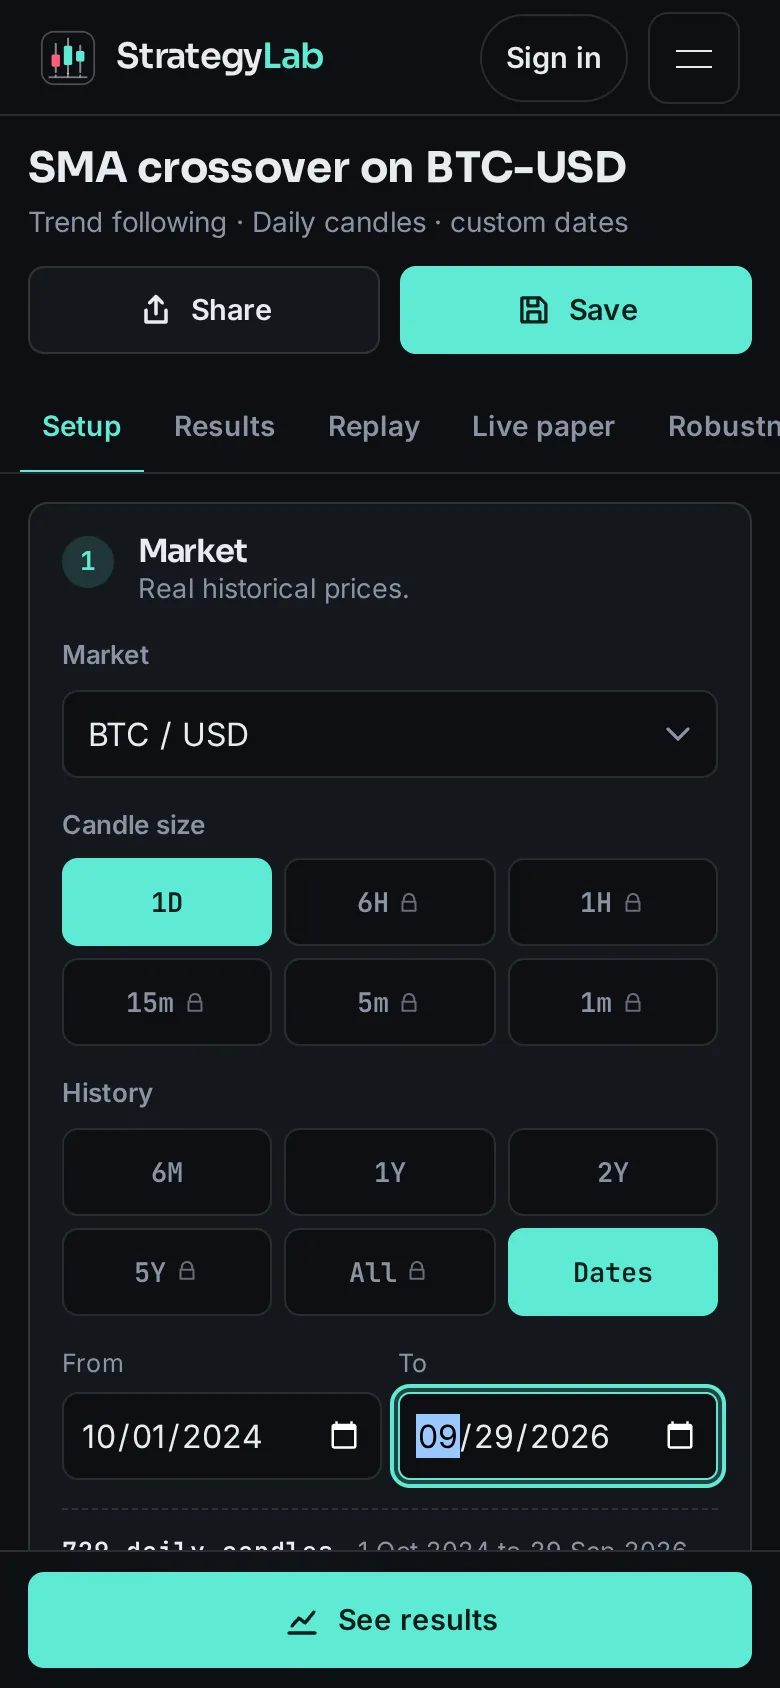
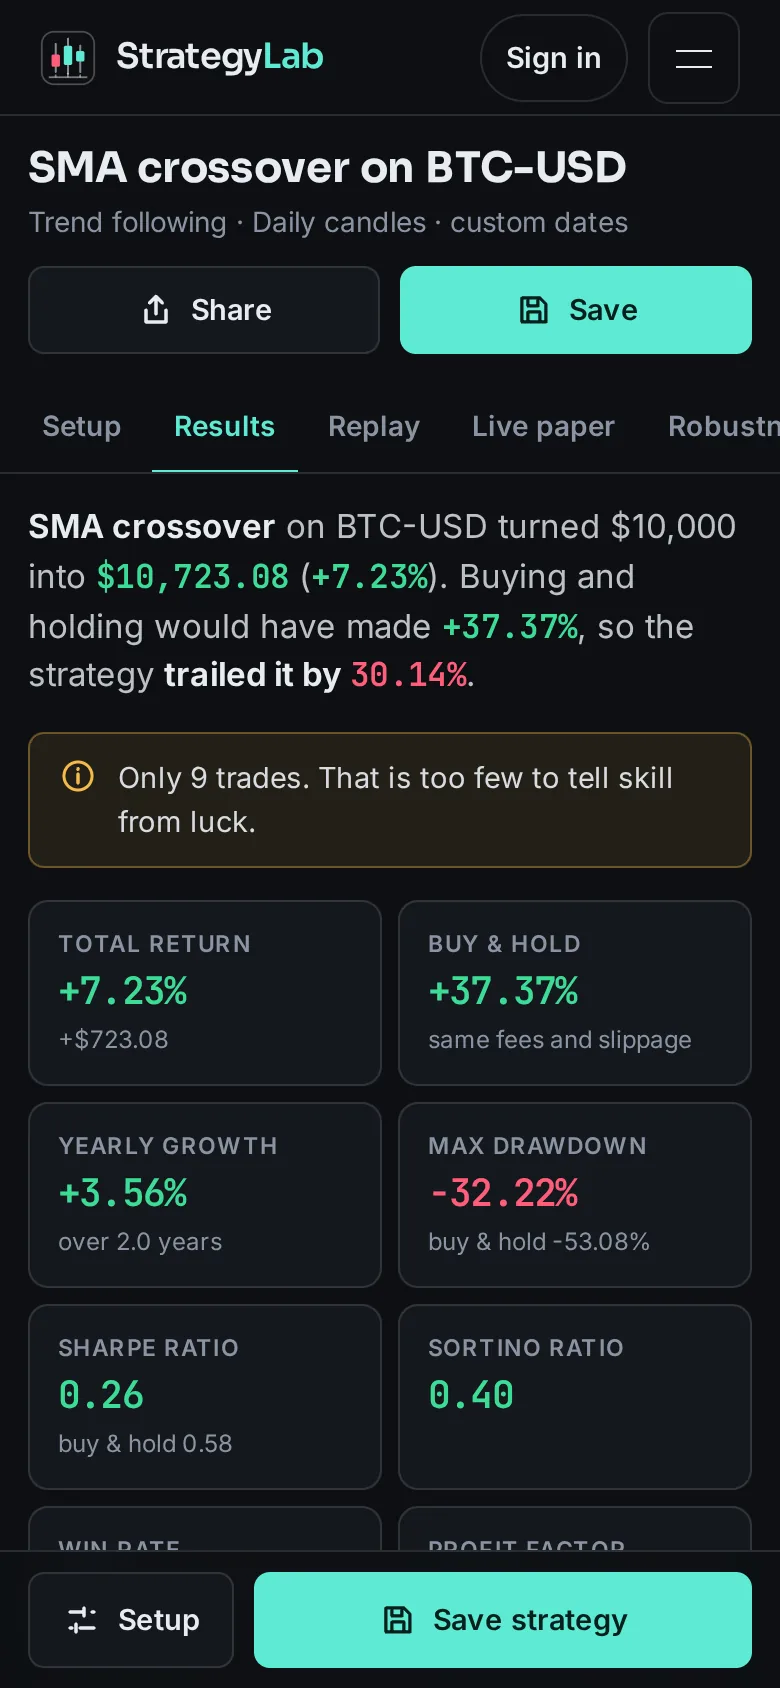
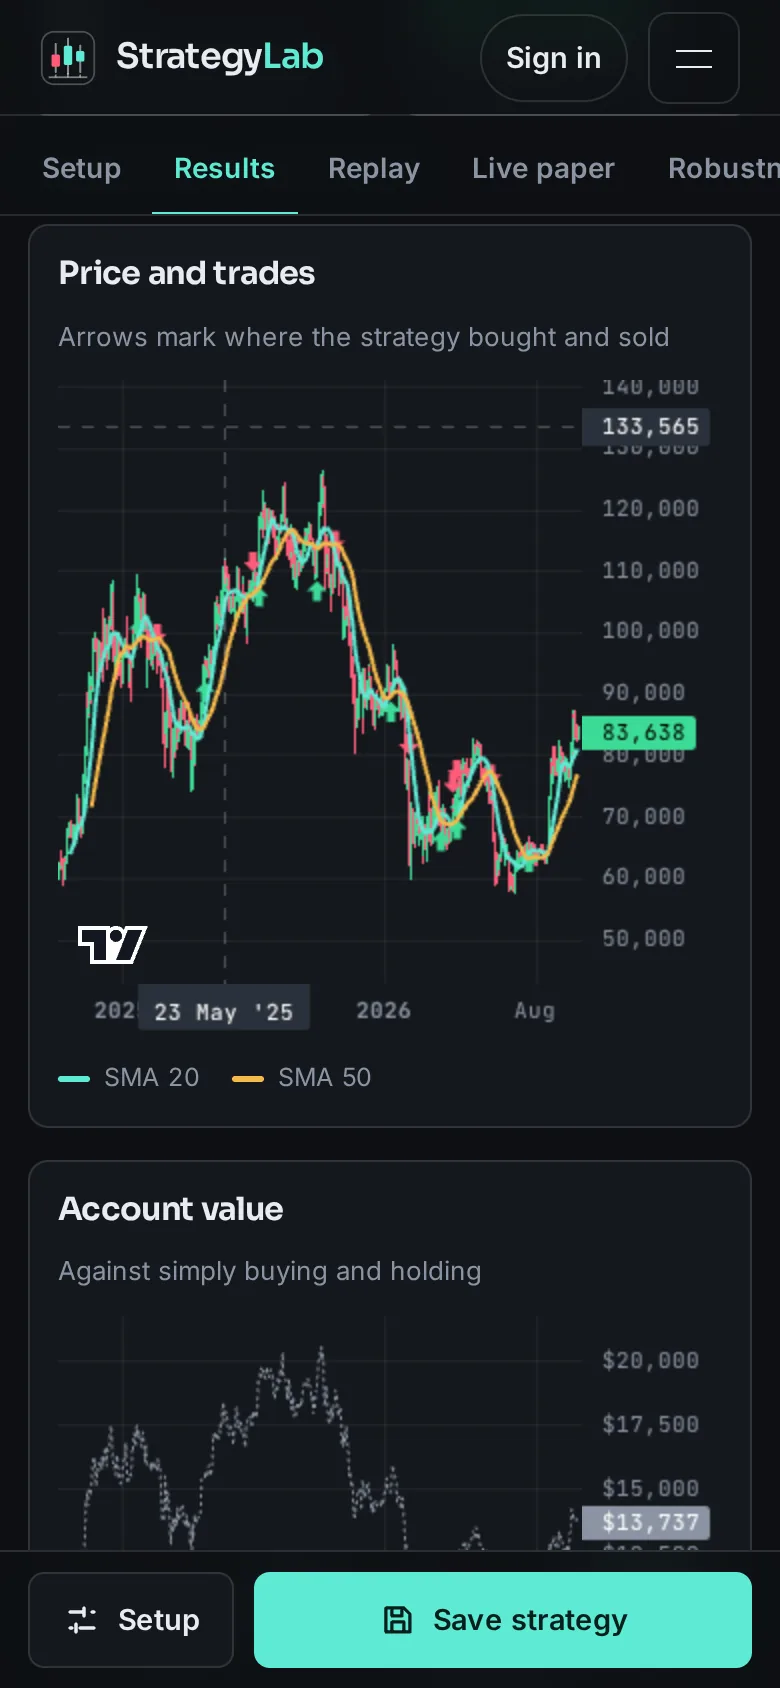
On a phone the tool is a single column with tabs along the top and one main button pinned at the bottom. Nothing is cut: the same strategies, the same charts, the same replay.

Setup on a phone: market, candle size and history buttons.
Fig. 13SetupExample data
Results on a phone: the verdict sentence, the nine-trades warning and metric tiles.
Fig. 14ResultsExample data
The price chart with buy and sell arrows on a phone, and the account value chart below it.
Fig. 15ChartsExample data
Replay on a phone: chart, play and next-candle buttons, speed and scrubber.
Fig. 16ReplayExample data

The example is already loaded.

Open the tool and it is running an SMA crossover on two years of real Bitcoin prices. Change one setting and watch the result move. No account until you save.

Try it freeSee pricing

Simulated results. Hypothetical performance has limits and is not a guarantee of future returns. Educational use only, not investment advice. Risk disclosure